I have been participating in the EPA’s Event Detection System Challenge (see phase III) held last year with a tool I developed named optiEDS.

During the Water Security Congress earlier this month in Nashville, Katie Umberg of the EPA presented the preliminary results of the challenge. Due to some restrictions and issues the five tools which participated in the challenge can’t be identified and they are named v, w, x, y and z. The names of the participating groups are mentioned in the presentation:

I hope the EPA will publish more detailed results in the near future so I can discuss them.

Tagged with: , , ,

Steffen Macke just blogged that he compiled EPANet for MAC using the Windows installer and Wineskin. I have not seen a MAC version yet so for a lot of folks this should be good news.

Grab the file from here.

Tagged with: ,

About a month I asked my readers to identify data-sets of digital and analog inputs of two sensors I connected to an iobridge  IO-204 Monitor and Control Module. I offered a prize of 100$ to the first correct answer.

I got a few guess:

  • toilet flushes and chlorine concentration (Jean-Baptiste)
  • room temperature and thermostat or smoke alarm (Luke)
  • room temperature and air conditioning On/Off switch (Gil)
  • water pressure and zone valves (wayne byal)
  • water pressure and start/stop of a pumping station (Nuno Dias)
  • water temperature in the water heater tank and heater status (omargut)

And … the resualts are in – on one got the full answer correct 🙂

As Jean-Baptiste noted, the Digital Input indicates toilet flushes. Luke guessed that the Analog Input is room temperature and he was almost correct – it is the water temperature in the toilet (omargut did say it was water temperature).

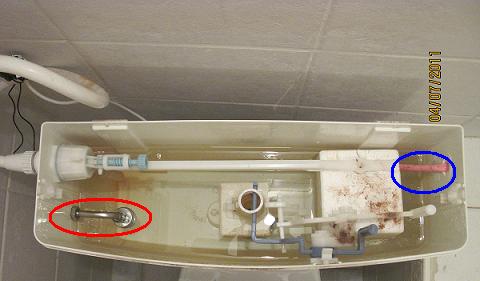
On the right side (red circle) is a stainless steel liquid float switch water level sensor (DI) and on the left side (blue circle) is a temperature sensor inserted in a balloon to protect the electric connection.

The logic behind the data is simple. If the toilet is not flushed for a long time, the temperature in the tanks will generally follow the room temperature.  When the toilet is flushed (change in the digital input), new water flows into the tank. If the water temperature in the house pipes is higher than the room temperature then we will see a quick rise in the analog data (and vise-versa). Now, as time goes by, we will see a gradually decrease\increase in the analog data as the water in toilet’s tank cool\heat.

The winners: well, as I wrote above, no one got it right. However, Jean-Baptiste and omargut were the closest so I guess I will split the prize between them.

Tagged with: , , , ,

There is a new version of HYDROFLO. See here.

In February 2005 I wrote about the beta version of HYDROFLO. Since then the program has matured into a commercial product.

From HYDROFLO web site:

HYDROFLO™ 2.1

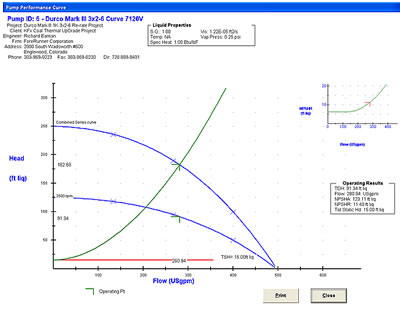
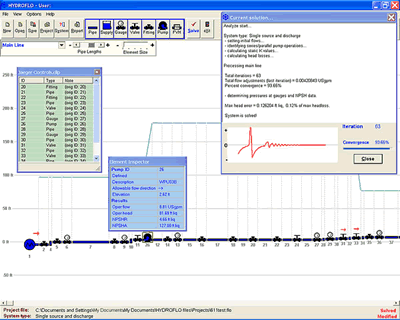
HYDROFLO is a software tool that assists piping system designers in the modeling and analysis of single source/single discharge, re-circulating and gravity flow piping systems. These systems are commonly found in industrial process, water supply, wastewater treatment, fire protection, chemical process, mine de-watering, irrigation and HVAC applications among others. The models created with HYDROFLO can consist of up to 10 parallels and hundreds of elements (pipes, valves, fittings, pumps and tanks). Virtually any type of system element can be described from the wide variety of available elements available on HYDROFLO’s menus. Element head losses can be described using flow vs. head loss curves, fixed head loss curves and custom friction coefficients.

HYDROFLO models systems conveying any type of incompressible fluid and solves for the full-pipe, steady-state pressures and flows. Hydraulic grade line plots are displayed in the workspace of solved systems so that suction and high-head conditions are easily observed. The Hazen-Williams equation is available for use with water systems and the Darcy-Weisbach equation is available for use with any type of incompressible fluid. Once a system’s total dynamic head and flow are found,PumpBase™ can be used to find the best pump for your application.

Systems are built by dragging and dropping both individual or groups of elements onto the workspace. HYDROFLO’s new clipboard is available for mass storage, moving and copying of elements. The clipboard can be saved separately from project data, so that a collection of pumps and/or other elements can be brought into any design.Fly-over element inspection (placing the mouse cursor over elements) lets you rapidly identify system components. Elements can be stretched and/or increased in image size for easier viewing. Eleven example problems with their data files are presented in the Help file that depict most of the possible situations that arise in system design.

Once a system is built, PDF reports of flows, pressures, line and pump graphics and other operational results can be previewed and printed. Individual or groups of elements can be edited using the new Group Editor. Elements can be “tagged” to assist with editing.

Note: I have not tested the program so the above information is not my personal view

Tagged with: , , ,

THE CONTEST IS OVER – resualts are here

Some time ago I reported the water pressure at my house connection. It was around 9 bars! Ever since I was looking for a way to monitor the water pressure and also had my eyes on monitoring flow and some water quality parameters.

A few weeks ago I took the first step and got an IO-204 Monitor and Control Module from ioBridge. The IO-204 module is a gateway to the World Wide Web connecting devices to the Internet. The module has four channels each with an analog input, digital I/O, pulse count, +5v DC Power and ground. This operation, of connection stuff to the web is called Internet Of Things (IOT). The thing can be any device, even a toaster like this guy did connecting his toaster to Twitter (also done with an IO-204 module).

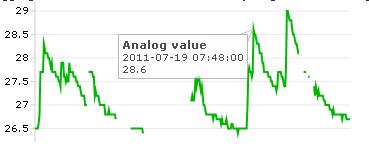
Before I can connect the thingsthat interest me to the web I had to do some learning and my first testing “project” is ready. Its somewhat ridiculous and simple but I did learn a lot from it. This small project has two sensors: one is an analog input (AI) and the other is digital (DI). The two inputs are shown, over time, in the two next on-line charts (I have made them load with a short delay to allow the full page to load first). The first is the AI showing three days of data in 12 minutes intervals. For some reason, which I could not fix, the time is shifted by two hours back (12am is actually 2am). The data logging and chart is one of the services you get from ioBridge with the IO-204 module.

Analog input

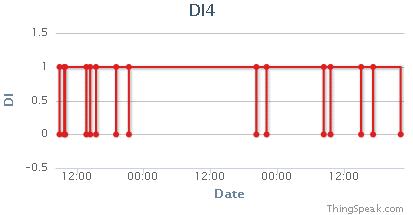
The second chart is the DI also showing three days of data but data is logged only when there is a change in the sensor’s state. For testing purposes I use a different service to plot this chart – thingspeak.com (powered by ioBridge):

About one week of AI and DI data is available in this zip file.

The contest
The first person who writes a comment to this post with the correct detailed explanation of the datasets will win 100$ US.

  • the contest will end on 30-Jun-2011 23:59.
  • payment will be made via PayPal.
  • clues or answers to questions might be given from time to time on this post and will be announced on the blog’s Twitter account @watersim
  • if you want to add a prize to the 100$ please contact me.

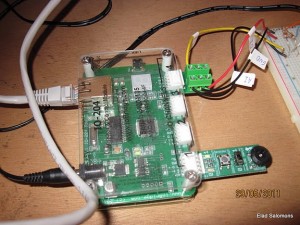
For those who are curious about the IO-204 module here are some pictures of my setup. First is the module itself with power and Ethernet connection on the left and the four channels on the right. The one on the far end is the one I used for this test.


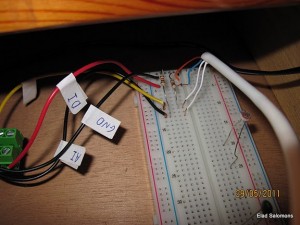
The second image is of the connections board with two 1K ohm pull-up resistor each.


Tagged with: , , , ,

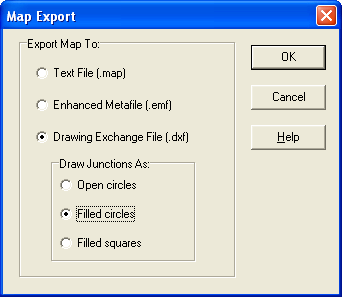
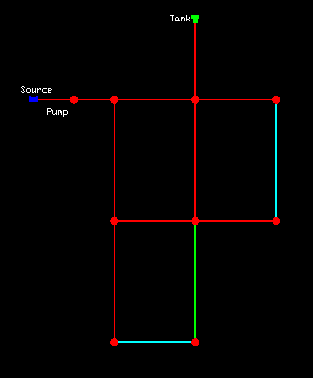
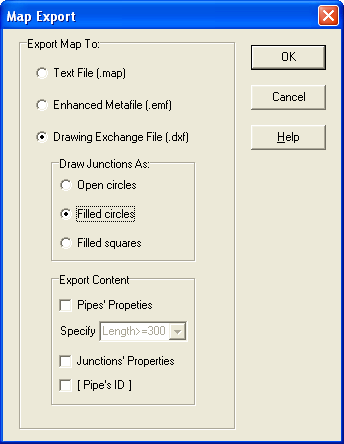
Baoyu Zhuang added a few functions to the EPANet GUI to allow more options while exporting a map to the DXF format. The USEPA version of EPANet allows the user to export a map to DXF using the File->Export->Map form:

Original EPANet map export

This export function will save a DXF file containing the nodes and links of the network and the labels. The elements color will be according to their selected viewed properties.

Original EPANet DXF export

Elements id’s, properties and results values are missing and that is were EPANet Plus kicks in. While starting with a small error message the program runs as expected. The difference is in the map export form:

EPANet Plus map export form

The upper part is the same as the original form but there is a new frame with the following functionality:

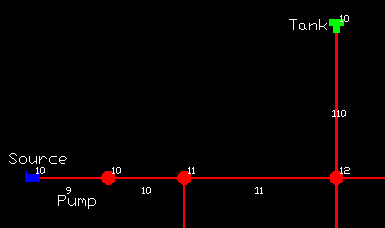
  • If no option is selected then the exported file will  be the same as the original program. However, if the display ID’s checkboxs are selected in the map options form then they will be shown in the DXF file:

Nodes and links ID's

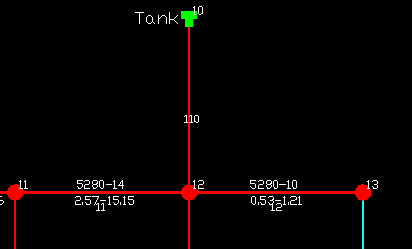
  • If the “Pipes Properties” box is selected then for each link longer then the selected value a set of properties will be shown (length, diameter, velocity and headloss).

Link properties

  • When the “Junctions Properties” box is selected the pressure and demand values will be shown for each junction.

Node's properties

  • The last option, “[Pipe’s ID], will just print the pipe’s ID in brackets.

Each set of values will be placed in a specific layer in the DXF file:

DXF layers

When I wrote about the future of EPANet and about open sourcing the program, this is one of the things I imagined – users and developers would add new features to the program. Zhuang didn’t release the source code of his changes but hopefully he would.

Download and use EPANet Plus form (at your own risk) here.

Update: Baoyu sent a few more tips for using EPANet Plus:

  1. Never try to export pipe’s and/or junction’s property before running the simulation.
  2. The position of junction’s property box could be changed according to the junction’s Tag property.  The position will be northeast, southwest and southeast to the junction while the Tag of that junction is set to 2, 3 and 4 respectively. If the Tag is set to other value or left blank, the position would be northwest of the junction.
  3. The font size is adjustable. It is controlled by both values of the font size and zoom level in Views – Options – Notation section
  4. Besides the enhancement of the export function, EPANET Plus fixes the arrow position issue. When a pipe has multiple sections, the position of link arrows could be placed at wrong position in the DXF exported by the original EPANET. The algorithm to calculate the position of link arrow was also updated for both export function and network map browser.
Tagged with: , , ,

I have just opened a twitter account for this blog, so why don’t you follow @watersim ?

Follow watersim on Twitter

Prof. Stefano Mambretti is the co-chairman of Urban Water 2012, the 1st International Conference on the Design, Construction, Maintenance, Monitoring and Control of Urban Water Systems to be held 25-27 April 2012 at New Forest, UK. He asked me to give notice for the call for papers. From the conference web-site:

Introduction

Water systems in the urban environment comprise supply networks as well as sewage and storm drainage systems. They interact with each other and with water bodies such as rivers, lakes and aquifers, and this interaction affects the quality and quantity of the different systems.

As our cities continue to expand, their urban infrastructure needs to be re-evaluated and adapted to new requirements related to the increase in population and the growing areas under urbanisation. New water systems are also required to reduce the risk associated with floods, network failures and many others associated with inadequate networks. New systems should reduce economic losses and environmental impacts as well as promote a higher degree of reliability to users. Improved management, measurement and control mechanisms are needed to ensure the efficiency and safety of urban water systems.

Topics such as contamination and pollution discharges in urban water bodies, as well as the monitoring of water recycling systems are currently receiving a great deal of attention from researchers and professional engineers working in the water industry. Architects and town planners are also aware of the importance of the interaction between urban water cycles and city planning and landscaping. Management of all these aspects require the development of specialised computer tools that can respond to the increased complexity of urban water systems.

Conference Topics

Water Supply:

  • Surface water and ground water sources
  • Water supply networks
  • Coping with water scarcity
  • Leakage and losses
  • Modelling systems
  • Optimization and control
  • Safety and security of water systems
  • Maintenance and repairs
  • Water quality
  • Water and sustainability
  • Water savings
  • Water re-use

Urban Drainage:

  • Waste water treatment and disposal
  • Structural works and infrastructure
  • Networks design
  • Real time control
  • Water quality issues
  • Combined sewer overflows
  • Storage tanks
  • Flood control
  • Environmental impact
  • Industrial waste water

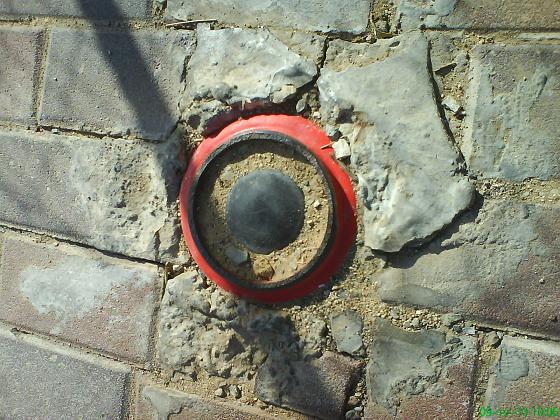
What do you see? The answer, posted on 27-01-2011 is at the end of the post

A free copy of EPANet will be awarded to everyone who submits an answer 🙂

Have you seen the pictures of the dry Niagara Falls?

Update 15/01/2011: most of you are right, this is a damaged fire hydrant. However, what is that black circle in the middle?

The answer 27/01/2011:as already stated this is a damaged fire hydrant. The black circle in the middle is a polycarbonate ball the prevents water from flowing out after the hydrant was damaged. When the hydrant is intactthere are steel holders which keep the ball lowered and allow water to flow. A schematic figure of the system, may be found here.

Tagged with: , ,

Unfortunately many of the links in this post are broken as the WaterWise project’s web-site was removed 🙁

I have been following the WaterWiSe@SG project for a few years now as I personally know one of the team members. Although I did hear from time to time bit and pieces of their work I could not really understand what the project is all about. For some reason the team did not publish their work and gave very little information about it.

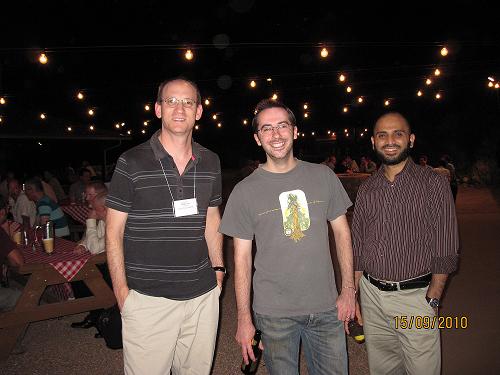
Only at WDSA 2010 I got to understand what they are doing and the potential of their work. I also had the privilege to meet a two more team members (from right to left: Mudasser Iqbal, Michael Allen and me).
What is the WaterWiSe@SG project?

The Wireless Water Sentinel project in Singapore (WaterWiSe@SG) is a collaboration between the Center for Environmental Sensing and Modeling (CENSAM) which is part of the Singapore-MIT Alliance for Research and Technology, the Singapore Public Utilities Board (PUB) and the Intelligent Systems Centre (IntelliSys) at the Nanyang Technological University (NTU). There are three official goals for the project:

  1. Demonstrate the application and control of a low cost wireless sensor network for high data rate, on-line monitoring of hydraulic (and other) parameters within a large urban water distribution system.
  2. Development of systems to enable remote detection of leaks and prediction of pipe burst events.
  3. Integrated monitoring of hydraulic and water quality parameters.

Prof. Andrew Whittle gave an overview talk about the WaterWiSe@SG project and its current status. The information in detail is available within the paper submitted o WDSA 2010 entitled WATERWISE@SG: a tested for continuous monitoring of the water distribution system in Singapore (PDF, 1.15MB). The leak detection, pipe burst prediction and the integration of quality parameters are still in development and seems promising. However, in my opinion, the first goal of the project, the application of a low cost wireless sensor network for high data rate, is the most important at this stage and have past the proof of concept stage. The ability to collect, analyze, transmit, store and use data in high rates (up to 2KHz) is impressive and would open the door for applications we still can’t think of. Leak detection and burst prediction is just the start. This infrastructure is a huge step towards the Water Smart Grid.

Sensors and data network

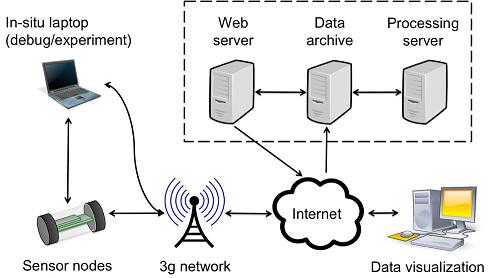
The sensor, actually Remote Terminal Unit (RTU), developed by the WATERWiSe@SG team, is based on the Gumstix open source hardware platform . They use one of the Gumstix Verdex Pro products which include a 800MHz CPU and runs a version of Linux (open source again). The module also has a SD card to store data when communication is down. The main COM (computer-On-Module) is connected to an expansion board with a GPS unit (used for time synchronization between units) and connectors to various sensors. The power consumption of the unit runs up to 6W when sampling and transmitting data. Data transmission is available via 3G modem or WiFi radio, both USB connected.
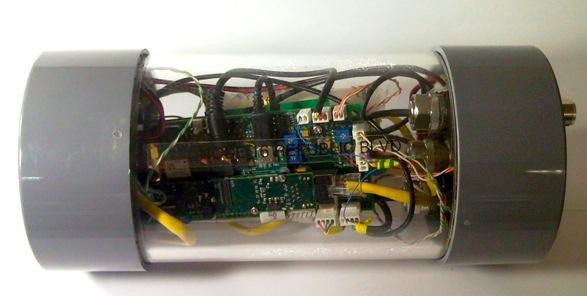
As mentioned above, the data is transmitted via the 3G network to the data archive server (MySQL database – open source again). The data is packed in compressed files with records of 30 seconds time windows.  Currently the system collects several signals: pressure , acoustic (hydrophone),  flow, pH and ORP. The data archive may be accessed directly for processing and viewed via a web portal.

The Water Smart Grid

The Smart Grid term is mainly associated with electricity networks. When thinking about a Water Smart Grid usually companies talk about consumption management and automated meter reading (AMR). For example Oracle and IBM. However, I think that the Water Smart Grids will be much more smarter very much thanks to projects like the WaterWiSe@SG project. High rate, low cost, data collection of various parameters would help the utilities in many ways and in different fields. The technical infrastructure laid by this project will push the research community towards applications which use real time large amount of data. Some of these applications are already being developed in the project and there are others too:

Keep your eyes on the WaterWiSe@SG project, its the future.

Disclosure: As of September 2011 I take part in the advisory board of Visenti Pte Ltd. which is spin-off company from the WaterWiSe@SG project.
Tagged with: , , , ,