Epanet 2
EPANET is a Windows 95/98/NT program that performs extended period simulation of hydraulic and water-quality behavior within pressurized pipe networks. A network can consist of pipes, nodes (pipe junctions), pumps, valves and storage tanks or reservoirs. EPANET tracks the flow of water in each pipe, the pressure at each node, the height of water in each tank, and the concentration of a chemical species throughout the network during a simulation period comprised of multiple time steps. In addition to chemical species, water age and source tracing can also be simulated.
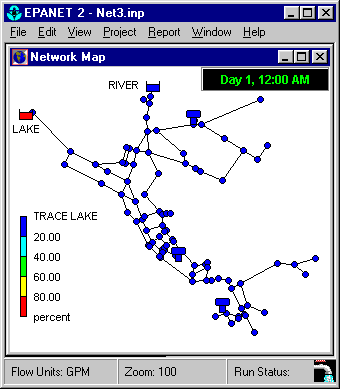
The Windows version of EPANET provides an integrated environment for editing network input data, running hydraulic and water quality simulations, and viewing the results in a variety of formats. These include color-coded network maps, data tables, time series graphs, and contour plots.
EPANET was developed by the Water Supply and Water Resources Division (formerly the Drinking Water Research Division) of the U.S. Environmental Protection Agency’s National Risk Management Research Laboratory. It is public domain software that may be freely copied and distributed.
EPANET capabilities:
- handle systems of any size
- compute friction head loss using the Hazen-Williams, Darcy-Weisbach, or Chezy-Manning formulas
- include minor head losses for bends, fittings, etc.
- model constant or variable speed pumps
- compute pumping energy and cost
- model various types of valves including shutoff, check, pressure regulating, and flow control valves
- allow storage tanks to have any shape (i.e., diameter can vary with height)
- consider multiple demand categories at nodes, each with its own pattern of time variation
- model pressure-dependent flow issuing from emitters (sprinkler heads)
- base system operation on simple tank level or timer controls as well as on complex rule-based controls
- model the movement of a non-reactive tracer material through the network over time
- model the movement and fate of a reactive material as it grows (e.g., a disinfection by-product) or decays (e.g., chlorine residual) with time
- model the age of water throughout a network
- track the percent of flow from a given node reaching all other nodes over time
- model reactions both in the bulk flow and at the pipe wall
- allow growth or decay reactions to proceed up to a limiting concentration
- employ global reaction rate coefficients that can be modified on a pipe-by-pipe basis
- allow for time-varying concentration or mass inputs at any location in the network
- model storage tanks as being either complete mix, plug flow, or two-compartment reactors
EPANET’s Windows user interface provides a visual network editor that simplifies the process of building piping network models and editing their properties. Various data reporting and visualization tools are used to assist in interpreting the results of a network analysis. These include graphical views (time series plots, profile plots, contour plots, etc.), tabular views, and special reports (energy usage, reaction, and calibration reports).
I would like to download EPANET software for my school project work
please send EPA NET software for my project.
best regard
Thilina.
I want to download this program (Epanent 2.0) looking forward for help.
regards
Hello,
In reality in water distribution systems, when flow into the system is stopped,emptying of the network is a gradual process and when flow is reinstated, refilling of the system happens also gradually. I have tried EPANET 2.0 and WaterGems but they both show instantaneous emptying and refilling of the network systems.
Are there any models that depict this gradual emptying and refilling of the network systems under the above situation?
Asaph,
Look at SWMM:
http://www.epa.gov/nrmrl/wswrd/wq/models/swmm/
The Storm Water Management Model can simulate pipe drainage.
Pls send EPANET software.
Best regard
Tadu.
Dear Asaph Mercy Kabaasha
It is true that when flow into the system is stopped,emptying of the network is a gradual process and when flow is reinstated, refilling of the system happens also gradually.
Epanet software can do what you want provided you set time steps which range from 1 to 24 hours. The interval are restricted to an hour inerval and it is useful to give out a picture of what is going on in the system.
Hello.
EPANET (Version 2.00.12 downloaded from http://www.epa.gov/nrmrl/wswrd/dw/epanet.html) was designed to run under the 32-bit Windows 95/98/NT operating system. The EPANET Programmer’s Toolkit was also designed to run under a 32-bit Windows operating system.
So, my question are: is it okay to run EPANET and EPANET Programmer’s Toolkit (32-bit, both stated previously) under a 64-bit Windows 7 or 8 operating system ? Or will I have problems in the future with these programs ?
Thank you.
There is no problem running EPANet under 64-bit Windows 7 & 8.
I will use a 64-bit Windows 7 Enterprise operating system with Epanet 2.00.12. I presume that it is ok. Again, thank you very much Elad.
problem using ENgetnodeid in vb6:
ENgetnodeindex “4a”,iii
iii= 4 the answer
ENgetnodeid iii, My_no_id
my_no_id = Empty is the answer
How did you define My_no_id?
You should use:
Dim My_no_id As String * 32
Thank you Elad Salomons: worked with this declaration statement of variable.
Douglas
I am using epanet dll in my VB.Net application. It’s working fine when performing demand-driven analysis of water distribution system. However, when performing pressure-dependent analysis, the resulted demands include both the actual demand plus the set demand which in return affects the flow in all links. Is there a way to get only the actual demand when running the pressure-driven analysis? Thanks you