Bay City may have located elusive water main break
Bay City officials believe they have finally found a water main break that has drained the city’s water system. This sign greeted people entering the Bay … …read more
Bay City officials believe they have finally found a water main break that has drained the city’s water system. This sign greeted people entering the Bay … …read more
MONSEY – Water service has been restored for dozens of residents in Rockland County following a water main break early Saturday morning. …read more
Water pressure may be low in some areas and residents should limit water usage. Police advise residents to avoid the area of the water main break. …read more
Crews have searched throughout the day for the source of the water main break, but have come up empty handed. An emergency meeting was … …read more
According to The Associated Press, Bay City officials were searching Sunday for the source of a water main break that was draining 10 million gallons … …read more
Bay City Bay City officials were searching Sunday for the source of a water main break that was draining 10 million gallons of water a day and … …read more
SAN DIEGO – Customers in Sorrento Valley are without water service Saturday while crews work to repair a water main break. The 12-inch concrete … …read more
ROTTERDAM, N.Y. — One road is closed in Rotterdam after a water main break, leaving some residents with low water pressure. The break happened … …read more
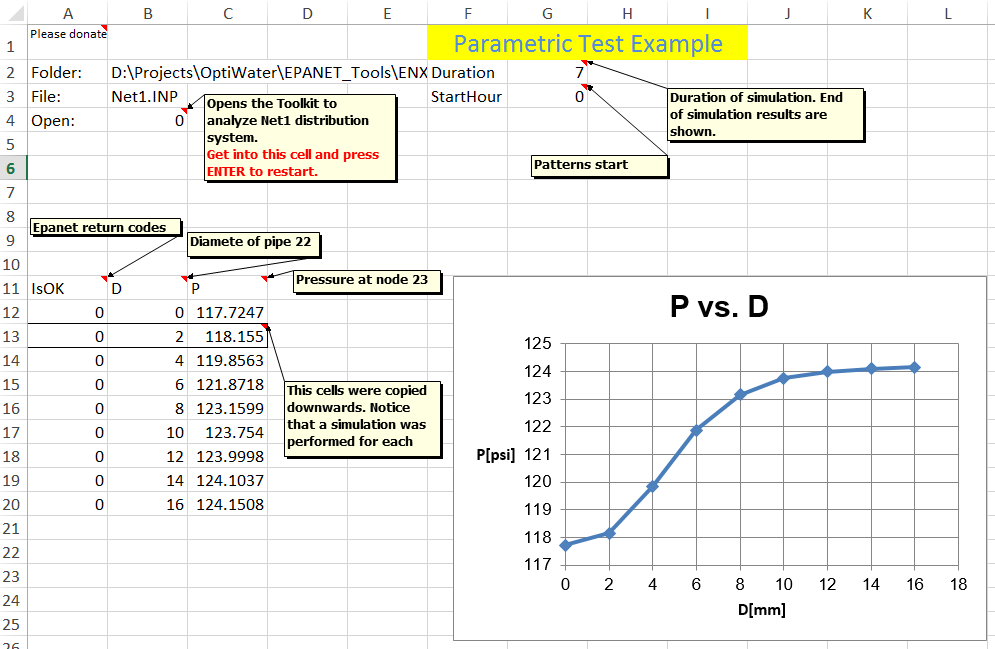
A colleague of mine sent me an Excel Add-In which utilize the EPANET Toolkit functions. This Add-In is just the right tool for all Excel users who want to make custom EPANET simulations without writing a line of code, just use function in Excel cells. From the Add-In documentation:
The EPANET Excel Add-in is open-source software which operates within the Excel environment, for providing an interface for the 2.0 version build 2.00.12 of EPANET (a hydraulic and quality modeling software created by the US EPA). With Excel, the user can perform complex network analyses without programming. The goal of the Add-In is to serve as a framework for:
Overview
The EPANET Excel Add-In features an easy way to use EPANET Toolkit functions in Excel. The Add-in functions are described in EPANET 2 Programmer’s Toolkit help. The functions are divided into 2 categories: “EPANET Traditional” includes all the functions of the toolkit and “EPANET Extended” includes functions based on the fundamental toolkit functions. (e.g. ENXLSetLinkDiameter).
Usage
Examples
Attached are a few examples. The path in the Excel sheet is the directory where the example networks (Net1, Net2 and Net3) are stored. Although the examples do not need the Add-in to operate, it is recommended to use the Add-in for new projects as a better practice (e.g. Add-in updates).
The Excel Add-In is distributed under the MIT license. Please report any bugs, issues and fixes to EpanetXL at gmail.com. If you use this software you may also use this email address to send PayPal donations.
Download EPANET Excel Add-In (ZIP, ~1MB)
Jim Uber posted on the EPANET-Users list that Lew Rossman, the creator of EPANET, has retired. He also sent the code of QHCSIM which Lew published back in 1991 and might be the first public version of a combined hydraulic and water quality solver. Here is Jim’s message:
Lew Rossman has announced on the SWMM-USERS list that he will be retiring from the USEPA as of April 1, 2014, after more than 30 years of service to his profession.
I’d guess that everybody on this list either has communicated directly with Lew over the years, or has heard of him; certainly everybody has used one of his software packages, EPANET. Lew has helped out so many people over his career through his interactions on water infrastructure modeling research, and is widely appreciated throughout the world for his contributions. To say he does not seek the limelight would be the understatement of the century, perhaps. But he will be missed dearly in terms of his work at the USEPA, by engineers and scientists of several different generations.
I was thinking of how to document, in some modest way, Lew’s contributions to potable water systems modeling. A colleague told me yesterday about how Microsoft had recently contributed the source code for Word 1.0 in order to document it’s significant place in computing history. So with that, I am attaching here the earliest know (to me) version of EPANET, in terms of the user’s guide and the source code, dated October 16, 1991. (At that early time, the name ‘EPANET’ didn’t exist, and Lew gave this experimental version the name ‘QHCSIM’.) As far as I know, this code is the first one to combine in one executable both hydraulic and water quality simulation capabilities – from the beginning the hallmark of EPANET. The code consisted of 1487 lines and I am sure fit comfortably on a 1.44 MB floppy drive ;-). A note from the user’s guide indicates that “The program can accommodate 100 nodes, 200 pipes, 10 tanks, and up to 50 pump control rules. For contaminant routing, a pipe can be divided into at most 50 volume segments.”
Perhaps this helps explain, by way of comparison to what is done today, Lew’s dedication to, and impact on, our field.
Here is QHCSIM source code and documentation (opens in a new tab).
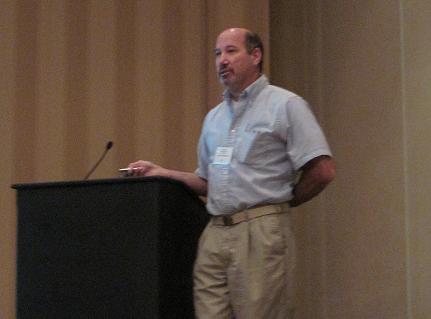
Lew Rossman at WDSA 2010
Lew, thank you for creating EPANET. It definitely made a difference and surly changed my professional career! I hope now you will have time for EPANET 3.