ATS-Chester developed an interface to link EPAג€™s EPANET software with ESRIג€™s ArcGISֲ® software (it seems that it is an old version).

Applications:

  • Water system modeling
  • Water quality management
  • Facility planning
  • GIS integration
  • User-friendly modeling

Features:

  • Developed using ESRIג€™s latest ArcObjects technology.
  • Adds a new toolbar to ArcGIS standard interface.
  • Allows you to create and edit your EPANET model from inside GIS.
  • Provides a synchronization tool to update existing models from GIS updates.
  • Exports GIS layers as a backdrop for EPANET model.
  • Allows displaying output results as a thematic map.
  • ArcView 3.x version (AVNet also available).

For more information see ATS-Chester web site.

Book related to the subject:
Arc Hydro: GIS for Water Resources

See the new look of StormwaterAuthority.org

StormwaterAuthority is a place where specifying engineers, contractors, developers, site owners and regulators can learn and share information. Itג€™s a place to research best management practices and regulations. A place with the latest news on stormwater management and treatment. A place that helps you implement the best plan, reduce short- and long-term costs, and make informed business decisions.

MWH Soft released InfoWater UDF, a solution for unidirectional flushing of drinking water distribution systems. InfoWater UDF delivers helps in managing the systematic flushing of water distribution systems to remove stagnant water along with mineral and sediment deposits that accumulate over time – restoring hydraulic capacity and improving water quality.

The hydraulic carrying capacity of pipes deteriorates with age, proportionate to the corrosive nature of the water and surrounding soils. Precipitation, microbiological activity and corrosion may all form deposits on the pipe walls. These accumulations increase hydraulic roughness and reduce the cross-sectional area and hydraulic carrying capacity of the mains. A loss in carrying capacity can lead to low pressures and the inability to deliver fire flows, especially during high demand periods. Slow-moving water can also result in a loss of chlorine residuals at stagnant spots, creating a public health risk. Problems associated with water quality degradation are particularly acute in dead-end lines and low-demand portions of water distribution systems.

More info at MWH Soft web site

From BOSS International:

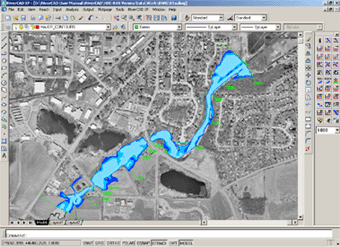
BOSS International has recently released RiverCADֲ® XP after 5 years of development. RiverCAD XP is a sophisticated river modeling software with a built-in CAD engine that completely supports the latest versions of HEC-RAS and HEC-2. Its slick GUI interface is intuitive. RiverCAD XP works within AutoCAD versions 2000 through 2006.

RiverCAD XP makes it easier than ever before to compute water surface profiles for modeling bridges, culverts, spillways, levees, bridge scour, floodway delineation, floodplain reclamation, stream diversions, channel improvements, and split flows. A stand-alone version will be available shortly.

RiverCAD web page

Following the Waterhammer in pipelines program a new item by the same author is available. The new program is called Pump Designer. Here is a few words from the author:

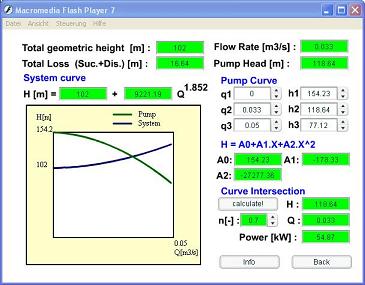
By means of this program you will have a aid to design a pump station for a simple pipeline system (1 line). You will can introduce the flow parameters, select the pipe type, select a suction and a discharge pipe and you will can also plot the system and pump curve for the selection of the pump size. The program calculates also the friction and local loss, the cavitation and the pump power.

You will can simulate with ease, for example, different flow rates, velocities, types of pipe materials, pipe diameters as well as also to plot your proposed pump curve.

Pump Designer web page

EPA has released a new tool for small water utilities trying to balance the demands for quality water with their financial ability to deliver. The tool is part of an overall program to protect public health, support small water systems and keep costs of water manageable. The targeted systems serve 3,300 customers or fewer.
The document, ג€œSetting Small Drinking Water System Rates for a Sustainable Future,ג€ will help owners and operators understand the full costs of providing a quality and adequate supply of drinking water to their customers and guide them in setting water rates that will support these costs.

The document is available at:
www.epa.gov/water/infrastructure/pdf/final_ratesetting_guide.pdf

Source: Safe Water Trust

From Elite Software Development:

“If you’re looking for a full featured domestic supply water pipe sizing program then S-Pipe is what you want. It has lots of built-in pipe and fitting data, plus the flexibility to let you enter your own data, plus a direct link with Autodesk Building Systems. Click the Download link on the left to try the functional demo today.”

Features

  • Sizes both hot and cold water supply systems
  • Calculates using ASHRAE and ASPE procedures
  • Supports all plumbing codes such as UPC, IPC, etc.
  • Computes demand GPM quantities, pipe specific and total accumulated pressure drops and velocities
  • Includes a single branch sizing calculator
  • All input data is checked as you enter it
  • Built-in data for pipes, fittings, and fixtures
  • Links to Autodesk Building Systems 2006
  • Prints bill of materials with labor costs
  • All built-in data can be changed by the user
  • Uses Hunter GPM Curve or your own
  • Allows for all types of pipe materials
  • Calculates demand water pressure and flow rates
  • Computes fitting equivalent lengths & fixture unit loads

Overview
S-Pipe computes optimal pipe sizes for hot and cold water domestic water supply systems in both residential and commercial buildings. It can handle systems with virtually unlimited numbers of pipes. Besides computing pipe sizes, S-Pipe can also perform a system analysis complete with a bill of materials and labor estimate. Reports list the GPM water flow, velocity, and pressure losses through all pipe sections, the maximum system demand pressure, and the total water GPM demanded by the system. S-Pipe is very easy to use as it contains built-in data concerning fitting equivalent lengths, pipe materials, internal pipe diameters and C-Values, fixture unit quantities and pressure requirements, equipment flow and pressure requirements, materials and labor costs, and demand GPM curves. Any or all of the built-in data can be revised to meet your particular needs.

More details at Elite Software Development web site

According to the New York Sun “New York City’s water supply could be the target of contamination if a water system map made its way into the wrong hands…”

New York City’s water supply could be the target of contamination if a water system map made its way into the wrong hands, an environmentalist said.

The threat has arisen since someone broke into a vehicle belonging to a Department of Environmental Protection maintenance supervisor and stole an agency laptop containing a map of the water system. If the map was detailed enough,”there could be the opportunity to pose a threat,” the executive director for the Center for Environmental Information, Cindy Stachowski, said. Even without a map, Ms. Stachowski added, someone pouring biological, chemical, or radiological contaminants into a fresh water source could adulterate the water system.

Source: The New York Sun

In an answer to a question titled “A question about backflow” on the EPANET User-List Elin Warn gave a link to an article by the EPA:

The purpose of this document is to review existing literature, research,and information on the occurrence, magnitude, and nature of the public health risks associated with cross-connections and backflow, from both acute and chronic exposures, and methods for detecting and controlling the occurrence of cross-connections and backflow within distribution systems. More specifically,the goal of
this document is to review what we know regarding:
(1)causes of contamination through cross-connections;
(2)the magnitude of risk associated with cross-connections and backflow;
(3)costs of backflow contamination incidents;
(4)other problems associated with backflow incidents;
(5)suitable measures for preventing and correcting problems caused by cross-connections and backflow;
(6)possible indicators of a backflow incident;
(7)research opportunities.

See the full text here.

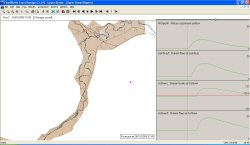
Wallingford Software announces that the latest release of FloodWorks, the real-time flood forecasting and flood warning system, now supports internet publishing of results. With this development, FloodWorks version 5.0, released at the end of 2005, can automatically publish flood forecasts on a website for viewing by remote users via a standard web browser.

FloodWorks provides real-time simulation and forecasting of hydrological and hydraulic conditions within river basins, drainage systems and the coastal zone. Designed for operational use in the control room, FloodWorks is particularly effective for real-time flood management, because it both provides forecasts of water level, flood depth and sea state for the hours or days ahead, and automatically disseminates detailed flood warnings.

There are many parties who need to know the details of the state of a river flood and the forecasts of imminent changes to flows and levels, including the various local authorities and emergency services located all along the river. FloodWorks was previously able to send out warning information by fax, email or SMS to a specified list of parties when certain critical conditions or levels were reached. That will continue, but now it will also be a simple matter to publish the latest information of flood forecasts to a website, and to provide access to authorized users. This has two benefits ג€“ more detail is available than can be contained in, for example, a text message, and information is available more frequently than that triggered when specific conditions are met.